06. Region Masking
region select
intro text
Coding up a Region of Interest Mask
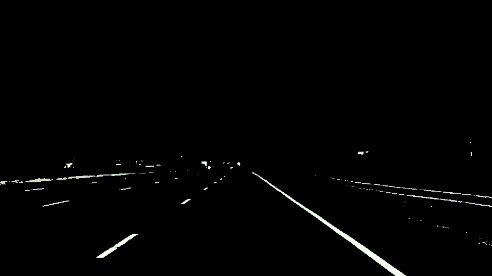
Awesome! Now you've seen that with a simple color selection we have managed to eliminate almost everything in the image except the lane lines.
At this point, however, it would still be tricky to extract the exact lines automatically, because we still have some other objects detected around the periphery that aren't lane lines.
colorSelect
code intro text
In this case, I'll assume that the front facing camera that took the image is mounted in a fixed position on the car, such that the lane lines will always appear in the same general region of the image. Next, I'll take advantage of this by adding a criterion to only consider pixels for color selection in the region where we expect to find the lane lines.
Check out the code below. The variables
left_bottom
,
right_bottom
, and
apex
represent the vertices of a triangular region that I would like to retain for my color selection, while masking everything else out. Here I'm using a triangular mask to illustrate the simplest case, but later you'll use a quadrilateral, and in principle, you could use any polygon.
region select code
import matplotlib.pyplot as plt
import matplotlib.image as mpimg
import numpy as np

# Read in the image and print some stats
image = mpimg.imread('test.jpg')
print('This image is: ', type(image),
         'with dimensions:', image.shape)

# Pull out the x and y sizes and make a copy of the image
ysize = image.shape[0]
xsize = image.shape[1]
region_select = np.copy(image)

# Define a triangle region of interest
# Keep in mind the origin (x=0, y=0) is in the upper left in image processing
# Note: if you run this code, you'll find these are not sensible values!!
# But you'll get a chance to play with them soon in a quiz
left_bottom = [0, 539]
right_bottom = [900, 300]
apex = [400, 0]

# Fit lines (y=Ax+B) to identify the  3 sided region of interest
# np.polyfit() returns the coefficients [A, B] of the fit
fit_left = np.polyfit((left_bottom[0], apex[0]), (left_bottom[1], apex[1]), 1)
fit_right = np.polyfit((right_bottom[0], apex[0]), (right_bottom[1], apex[1]), 1)
fit_bottom = np.polyfit((left_bottom[0], right_bottom[0]), (left_bottom[1], right_bottom[1]), 1)

# Find the region inside the lines
XX, YY = np.meshgrid(np.arange(0, xsize), np.arange(0, ysize))
region_thresholds = (YY > (XX*fit_left[0] + fit_left[1])) & \
                    (YY > (XX*fit_right[0] + fit_right[1])) & \
                    (YY < (XX*fit_bottom[0] + fit_bottom[1]))

# Color pixels red which are inside the region of interest
region_select[region_thresholds] = [255, 0, 0]

# Display the image
plt.imshow(region_select)

# uncomment if plot does not display
# plt.show()